Histogram Mode
You turn on the histogram mode by clicking the ![]() button on the main tool bar. Activating the histogram mode pops up a histogram window. What is displayed within the window depends on the current image and the settings.
button on the main tool bar. Activating the histogram mode pops up a histogram window. What is displayed within the window depends on the current image and the settings.
.png)
.png)
.png)
.png)
.png)
Histogram/Waveform
![]()
These radio buttons let you select histograms or waveforms. If you are displaying histograms, clicking anywhere on the input image will display a red marker line on the histogram at the location in the histogram that corresponds to the color of the image where you clicked. This is helpful in understanding what part of the histogram different parts of the image contribute to. Markers accumulate as you click or drag over the input image -- to clear them, click the Erase Markers button (see below).
What is a Waveform?
Waveforms are related to histograms but include additional spatial information. In a histogram, pixels are counted regardless of their location in the input image. In a waveform, the horizontal axis of the waveform corresponds to the horizontal axis of the image, so, for example, the left edge of the waveform is computed from the left edge of the image and the right edge of the waveform is computed from the right edge of the image.
The vertical axis of the waveform corresponds to brightness of the input image, with black at the bottom edge and white at the top, so. In effect, each vertical line in the waveform is like a histogram of the corresponding vertical line in the input image where the height of the histogram is represented by the brightness of the waveform. For HSV-V and HSL-L waveforms, the color of the image is also reflected the waveform. For RGB waveforms, the red, green and blue channel waveforms are superimposed, each in its own color. For all other channels, the waveform is black and white only.
How to Interpret a Waveform
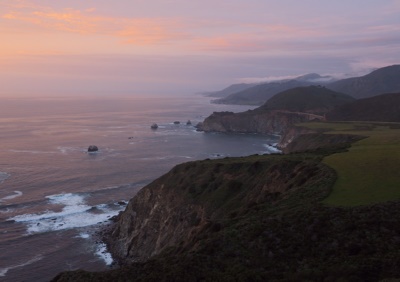
Looking at the example image and the HSV-V waveform above, the greens at the bottom of the waveform correspond to the dark green leaves. The white areas above correspond to the bright iris petals, and if you look carefully, there are also some yellows in the upper part of the waveform. As you can see, some of the positional information that is lost from the histogram is retained in the waveform.
Highlight clipping shows up in the waveform as bright areas at the top of the waveform and shadow clipping shows up as bright areas at the bottom. One of the advantages of waveforms over histograms is that you can tell what part of your image has clipped highlights as in some cases you may not care about a clipped background as long as your main subject is properly exposed.
Tips
To make the waveform more visible, increase the expansion factor.
Erase Markers
![]()
Clicking this button erases and histogram markers you have created.
Color Space
This setting determines what channel (or channels) of color images are histogrammed. For black and white images, there is only one channel, so the color space setting is ignored.
HSV-H -- HSV Hue.
HSV-S -- HSV Saturation.
HSV-V -- HSV Value.
HSV-HS -- HSV Hue and Saturation.
HSL-H -- HSL Hue.
HSL-S -- HSL Saturation.
HSL-L -- HSL Lightness.
HSL-HS -- HSL Hue and Saturation.
R -- Red.
G -- Green.
B -- Blue.
RGB -- Red, Green and Blue.
Luminance -- Luminance.
For HSV-HS and HSL-HS, a 2-dimensional Hue/Saturation histogram is displayed:
.png)
The dots represent locations on the color wheel with white in the center and more saturated colors toward the edge. The brightness of each dot is proportional to the number of pixels in the image which most closely match that hue and saturation.
Expansion Factor
This setting applies a nonlinear scale factor to the vertical axis of the histogram which exaggerates small histogram values. If the scale factor is 1.0, no histogram expansion is performed. As you move the slider to the right, expansion is progressively increased. Histograms are automatically scaled so the largest value just fits the graph. Thus, the histogram of an image with a large number of pixels of the same value will have a large spike at that value. This in turn means that other values in the histogram may be displayed so small as to be difficult or impossible to see. In this case, increasing the expansion factor can bring out detail that would otherwise be lost. This can be particularly useful when checking for clipped highlights or shadows that amount to only a small area in the image.
As with regular histograms, expansion can be used with 2-dimensional Hue/Saturation histograms and waveforms to make the darkest dots more visible.
Tips
If you leave the Histogram dialog box open while you are adjusting the settings in a transformation, the histogram is automatically updated with every change in the output image of the transformation and also when you select new images. This lets you see instantly how your changes affect the histogram or waveform of the image or compare the histograms of two or more different images.